
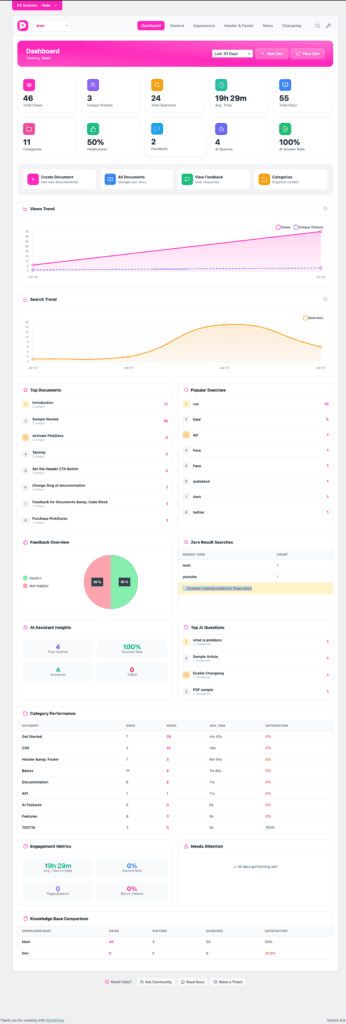
The Advanced Analytics Dashboard gives you a complete overview of how users interact with your documentation. It helps you understand what content performs well, what users are searching for, where they get stuck, and how effective your AI assistant is.
All data updates automatically and can be filtered by date range.
Accessing Advanced Analytics
Navigate to:
Dashboard → Analytics
By default, the dashboard shows data for the last 30 days, which you can change using the date selector at the top.
Overview Metrics
At the top of the dashboard, you’ll see a quick snapshot of key performance indicators.
Total Views
The total number of times documentation pages were viewed.
Unique Visitors
The number of individual users who visited your documentation.
Total Searches
How many searches were performed using the documentation search bar.
Average Time
The average time users spend reading your documentation.
Total Docs
The total number of published documents in the selected knowledge base.
Categories
The number of categories used to organize documents.
Helpfulness
The percentage of users who marked documentation as helpful.
Feedback
Total feedback responses collected from readers.
AI Queries
The number of questions asked using the AI Assistant.
AI Answer Rate
The percentage of AI queries successfully answered.
Quick Actions
Below the metrics, you’ll find shortcuts to common actions:
- Create Document – Add a new documentation page
- All Documents – Manage and edit existing docs
- View Feedback – Review user feedback and ratings
- Categories – Organize documentation structure
These actions help you move from insights to action quickly.
Views Trend
The Views Trend chart shows how engagement changes over time.
- Tracks total views and unique visitors
- Helps identify growth, drops, or spikes in traffic
- Useful for measuring the impact of updates, releases, or announcements
Search Trend
The Search Trend chart displays how often users search your documentation.
- Highlights days with high search activity
- Indicates when users are actively looking for answers
- A sudden rise may suggest missing or unclear content
Top Documents
This section lists the most viewed documentation pages.
For each document, you can see:
- Document name
- Number of unique views
Use this to:
- Identify high-performing content
- Improve or expand popular topics
- Spot important docs that should be easier to find
Popular Searches
Shows the most common search terms entered by users.
This helps you:
- Understand what users expect to find
- Detect feature-related or setup-related confusion
- Optimize titles, tags, and content wording
Feedback Overview
A visual breakdown of:
- Helpful
- Not Helpful
This reflects overall documentation quality and clarity.
A high “Not Helpful” percentage usually means content needs simplification, examples, or better structure.
Zero Result Searches
Displays search terms that returned no results.
This is one of the most important insights because it:
- Reveals missing documentation
- Shows what users want but can’t find
- Helps you prioritize new content creation
Tip: Creating documents for these terms can significantly reduce support tickets.
AI Assistant Insights
Provides performance data for the built-in AI Assistant.
Includes:
- Total AI queries
- Answered queries
- Failed queries
- Overall success rate
Use this data to:
- Improve documentation coverage
- Identify questions the AI cannot answer due to missing content
- Measure AI effectiveness over time
Top AI Questions
Lists the most frequently asked questions via the AI Assistant.
This helps you:
- Spot recurring user problems
- Convert popular AI questions into dedicated documentation pages
- Improve onboarding and setup guides
Category Performance
Shows how each documentation category performs.
For every category, you can see:
- Number of documents
- Total views
- Average reading time
- Satisfaction score
This helps identify:
- Categories users care about most
- Categories that need better content
- Areas users are skipping entirely
Engagement Metrics
Tracks overall user engagement behavior:
- Average Time on Page
- Bounce Rate
- Pages per Session
- Returning Visitors
These metrics indicate how engaging and useful your documentation feels to users.
Needs Attention
A system-generated status indicator.
- Alerts you if documents are underperforming
- Confirms when all content is performing well
- Helps prioritize optimization efforts
Knowledge Base Comparison
If you manage multiple knowledge bases, this section compares them.
For each knowledge base, it shows:
- Views
- Visitors
- Searches
- Satisfaction score
Useful for:
- Comparing public vs internal docs
- Measuring adoption across different audiences
- Identifying which knowledge base needs improvement
Best Practices
- Regularly review Zero Result Searches
- Improve documents with low helpfulness scores
- Use Popular Searches to refine titles and tags
- Turn top AI questions into permanent documentation
- Track trends after product updates or releases
Summary
The Advanced Analytics Dashboard is designed to help you:
- Understand user behavior
- Improve documentation quality
- Reduce support load
- Make data-driven content decisions
By consistently reviewing these insights, you can build a faster, clearer, and more effective knowledge base experience.